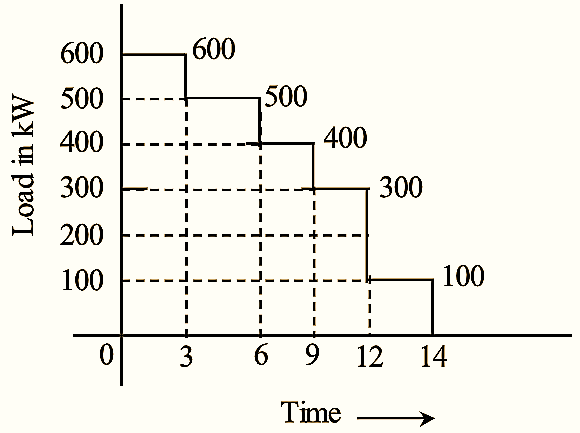
Figure 1: Load Duration Curve.
Load Duration Curve is drawn with time on x-axis and variation of load on y-axis, but the loads are an-angled in particular order usually descending Order Of magnitude. This curve can be obtained from ordinary load curve that the greatest load is on left and least load on extreme right of the graph. Utility Of Load and Load Duration Curves in the
Significance of Load Duration Curve
- Maximum and minimum demands can be determined by using load duration curve.
- It is useful for financial analysis of a power plant
- Load duration curve gives the amount of energy which can be generated by taking load factor of the system as 100%.
- Total energy consumption can be found out by considering the area under load duration curve.
- Capacity of base load plant and peak load plant can be decided by studying the load duration curve carefully.
- It helps to predict the capacity of generator.
- It helps in working out the operational economics of the plant.
- It helps in evaluating the average demand on the station.
The above information is useful in deciding the size of units to be installed and also in preparing operation schedule of generating units.
Integrated Load Duration Curve
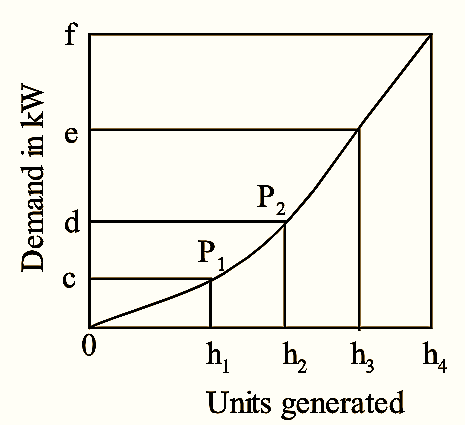
Integrated Load Duration Curve represents the total number of units (kWh) generated for the given demand in kW The ordinates represent the demand in kW and the abscissa represents kWh. Such a curve can be obtained from the load duration curve. The number of units generated (h1) corresponding to this load demand are represented by the area 0abc. It corresponds to point P1 on the integrated duration curve of figure 2. The integrated load duration curves are useful, where the given number of kWh units are available. Also the load in kW that could be carried at the base or peak from a river flow can be easily determined by the integrated load duration curve. The total number of units generated for a given demand can be obtained from this curve.